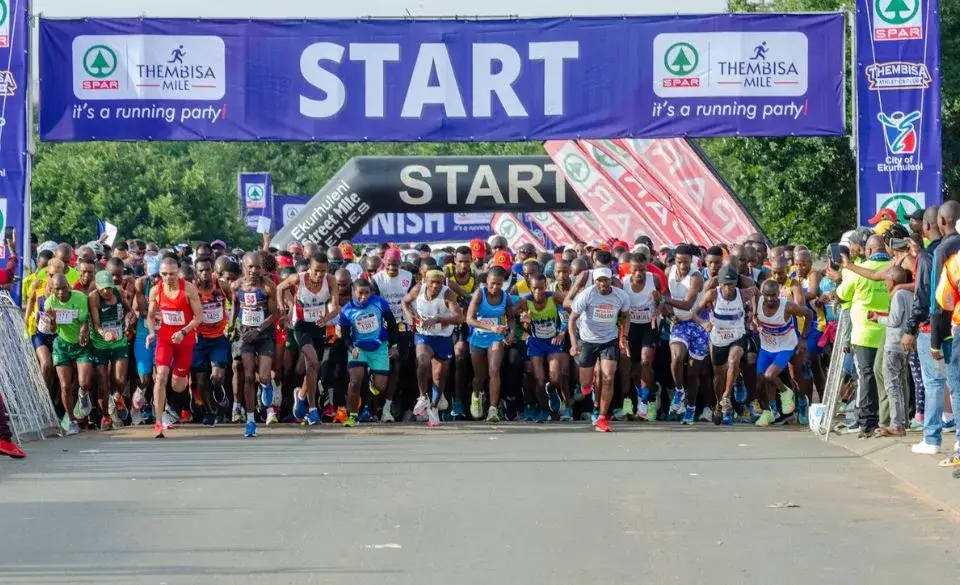




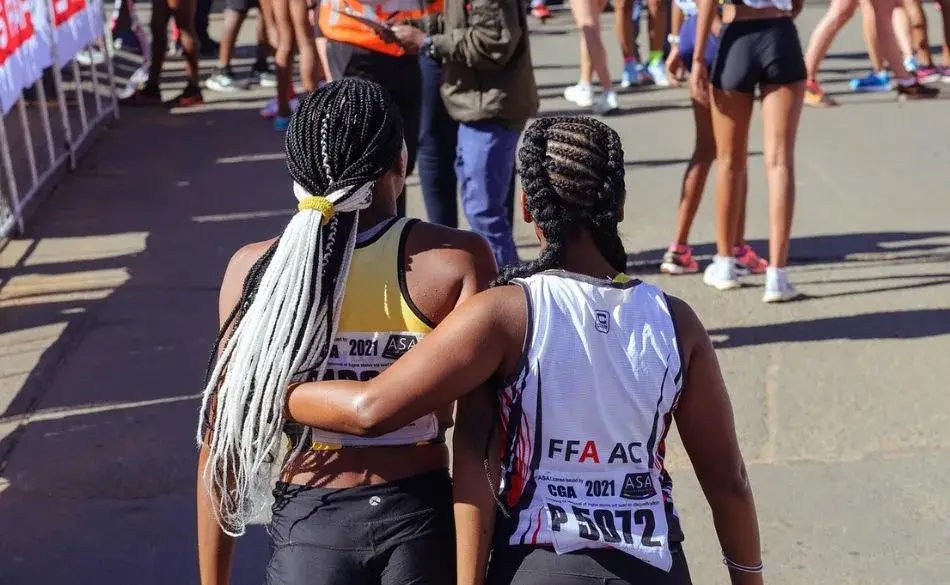


Find Your Next Running Race
Ready to put your training to the test? Here are some upcoming running events matched to this article.
 Coach Graeme

Last updated:
About 1.1 million people finish a marathon each year worldwide — just 0.01% of the global population. Fewer than 1% of people will ever complete one in their lifetime. If you've crossed a marathon finish line, you've done something that 99% of humanity never will.
Not sure where to start with training?
Tell us your goal and schedule, and we’ll give you clear direction.
No obligation. Quick, practical advice.
Explore our running training content for more helpful articles and resources.
👉 Swipe to view full table
| Statistic | Number |
|---|---|
| Annual marathon finishers (worldwide) | ~1.1–1.3 million |
| % of global population finishing per year | ~0.01–0.02% |
| Estimated lifetime finishers (all time) | ~10–15 million unique people |
| % of global population who have EVER finished | <0.2% |
| Marathon events held per year | ~800–1,100+ |
| First-timers as % of annual finishers | ~50% |
| % of finishers who are women | ~35% (45% in the US) |
| Average age of marathon finishers | ~40 years |
Source: RunRepeat State of Running (107.9 million race results, 1986–2018), International Institute for Race Medicine, World Athletics.
👉 Swipe to view full table
| Country | Annual Marathon Finishers (est.) | % of Country Population |
|---|---|---|
| United States | ~430,000 | ~0.13% |
| Japan | ~250,000 | ~0.20% |
| China | ~130,000 | ~0.01% |
| United Kingdom | ~70,000 | ~0.10% |
| Germany | ~60,000 | ~0.07% |
| France | ~50,000 | ~0.07% |
| Canada | ~40,000 | ~0.10% |
| Australia | ~25,000 | ~0.09% |
| South Korea | ~20,000 | ~0.04% |
| Italy | ~18,000 | ~0.03% |
The US dominates in total numbers, but Japan has the highest per-capita marathon participation of any major country. Marathon running remains heavily concentrated in North America, Western Europe, Japan, and Oceania — reflecting access to events, training resources, and disposable income.
👉 Swipe to view full table
| Marathon | Annual Finishers (approx.) | Notable Feature |
|---|---|---|
| New York City Marathon | ~51,000 | Largest marathon in the world |
| Chicago Marathon | ~45,000 | Fast, flat course |
| London Marathon | ~42,000 | Lottery entry, huge charity presence |
| Berlin Marathon | ~40,000 | World record course |
| Tokyo Marathon | ~38,000 | High demand, lottery-based entry |
| Boston Marathon | ~30,000 | Qualification required (BQ times) |
These six World Marathon Majors account for roughly 250,000 finishers — about 20% of the global annual total. The remaining 80% come from hundreds of mid-size and local marathons worldwide. For the best marathons to run, see our guides to best marathons in Europe, best marathons in Asia, and best marathons in Canada.
👉 Swipe to view full table
| Decade | Trend | Key Change |
|---|---|---|
| 1970s–1980s | First running boom | Marathon participation grew from niche to mainstream. Most finishers were competitive runners with fast times. |
| 1990s–2000s | Second boom | Charity entries, "bucket list" marathons, and first-time runners expanded participation dramatically. |
| 2010s | Tech + accessibility | GPS watches, training apps, and online coaching made preparation accessible to everyone. Average times slowed as more recreational runners joined. |
| 2020–2021 | COVID disruption | Thousands of races cancelled. Virtual events filled some gaps but participation dropped significantly. |
| 2022–present | Strong recovery | Live events returned with record registration. Marathon Majors reporting all-time high demand. |
Average marathon finish times have slowed from ~3:30–3:50 in the 1980s to ~4:20–4:50 today. This isn’t because runners are getting slower — it’s because the field has expanded to include far more recreational runners, walkers, and first-timers. The front of the pack is faster than ever.
👉 Swipe to view full table
| Demographic | Stat |
|---|---|
| Gender split (global) | ~65% men, ~35% women |
| Gender split (US) | ~55% men, ~45% women |
| Largest age group | 40–49 (31%) and 30–39 (31%) |
| Average finisher age | ~40 years old |
| Average men's finish time | ~4:21 |
| Average women's finish time | ~4:48 |
| DNF rate (did not finish) | ~2–5% of starters |
The 40–49 age group is now the largest in marathon running — a shift from the 1990s when 25–34-year-olds dominated. This reflects the growing trend of runners discovering the marathon in midlife, often after building years of fitness through shorter races.
If you’ve finished a marathon, you’re in a group that less than 1% of people ever join. If you haven’t, the numbers shouldn’t intimidate you — they should motivate you. Every one of those 1.1 million annual finishers started by running their first kilometre. Most began with shorter distances and built up over months.
The most common path: Couch to 5K → 10K → half marathon → marathon. Each step builds the endurance and confidence for the next. Our beginner marathon training plan covers the final step — a 16-week programme designed for first-timers.
How many people have run a marathon?
An estimated 10–15 million unique individuals have ever finished a marathon — less than 0.2% of the world population.
How many people run a marathon each year?
About 1.1–1.3 million worldwide. That’s ~0.01–0.02% of the global population.
What percentage of the population has run a marathon?
Less than 1% lifetime. In the US, about 0.13% finish one per year.
Which country has the most marathon runners?
The US (~430,000/year), followed by Japan (~250,000/year).
What’s the average marathon finish time?
~4:21 for men, ~4:48 for women. Average times have slowed because more recreational runners now participate.
Running a marathon is rare. That’s exactly what makes it worth doing.
Our 16-week beginner marathon plan takes you from half-marathon fitness to the finish line. Or get personalised guidance with our Running Coaching.
Ready to put your training to the test? Here are some upcoming running events matched to this article.



Head Coach & Founder, SportCoaching
Graeme is the founder of SportCoaching and has coached more than 750 athletes from 20 countries, from beginners to Olympians, in cycling, running, triathlon, mountain biking, boxing, and skiing. His coaching philosophy and methods form the foundation of SportCoaching's training programs and resources.
No matter your goals, SportCoaching offers tailored training plans to suit your needs. Whether you’re preparing for a race, tackling long distances, or simply improving your fitness, our expert coaches provide structured guidance to help you reach your full potential.
Smart, progressive training from 5km to marathon with weekly guidance.
What’s included
Browse upcoming Australian running, cycling, and triathlon events in one place. Filter by sport, check dates quickly, and plan your training around something real on the calendar.
Choose your plan to get started with personalized training plans designed to help you reach your goals.


Minna Backman
When you’re new, feedback is especially important, and Graeme is highly skilled at both analyzing numbers and understanding the importance of mental strength.