




Find Your Next Cycling Race
Ready to put your training to the test? Here are some upcoming cycling events matched to this article.
 Coach Graeme

Last updated:
A power meter is the most accurate training tool available to a cyclist. It measures the actual work your legs are producing — in watts, in real time — without being affected by heat, fatigue, caffeine, or how you slept. That objectivity is what makes it so valuable. Heart rate tells you how your body is responding to effort. Power tells you what the effort actually is. And for structured training, knowing what the effort actually is matters enormously.
This guide covers how power meters work, the types available and which suits different riders, how to set up and calibrate one correctly, the key metrics that are actually worth understanding, how to use power zones for structured sessions, and how to pace with power in the real world — which is a different skill from knowing the theory.
Not sure where to start with training?
Tell us your goal and schedule, and we’ll give you clear direction.
No obligation. Quick, practical advice.
Explore our cycling training advice for more helpful articles and resources.
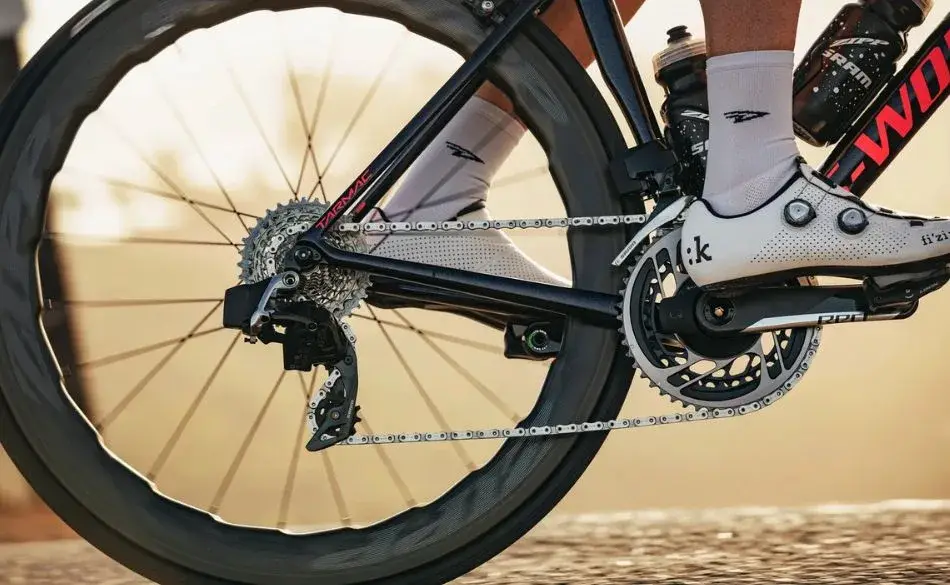
A power meter is a device containing strain gauges — sensors that detect microscopic flexing of a drivetrain component when force is applied to it. As you pedal, you apply torque to the cranks, pedals, or chainring; the strain gauges measure that torque. Combined with your cadence (pedal revolutions per minute), the device calculates power using the formula Power = Force × Velocity, and displays it in watts on your cycling computer.
The measurement is immediate. Unlike heart rate, which is a lagging physiological response that takes 20–60 seconds to reflect a change in effort, power responds within a second or two. This makes it far more useful for short, intense efforts — intervals, sprint training, and pacing on climbs — where heart rate is too slow to be reliable guidance. It also means power data is directly comparable between rides, regardless of external conditions like heat, humidity, or how stressed you were that morning.
The primary limitation is that power measures mechanical output, not physiological state. A ride at 250 watts when you’re fresh feels and physiologically is different from 250 watts at the end of a 5-hour effort. This is why power works best alongside heart rate and perceived exertion — not as a replacement for either.
| Type | Where it measures | Accuracy | Main advantage | Main limitation | Best for |
|---|---|---|---|---|---|
| Pedal-based (e.g. Garmin Rally, Favero Assioma) | At the pedal axle | ±1–2% | Moves easily between bikes; left/right balance data | Cleat system compatibility; vulnerable to impacts | Riders with multiple bikes; those wanting balance data |
| Crank arm (e.g. Stages, 4iiii) | Left crank arm (single-sided) or both arms | ±1–2% (dual-sided); single-sided doubles the left leg | Affordable; easy to swap between bikes | Single-sided estimates can be inaccurate if left/right power balance is asymmetric | Budget-conscious riders; recreational cyclists; those with symmetric pedalling |
| Spider/crankset (e.g. Quarq, SRAM Red) | Chainring spider | ±1–1.5% | Very accurate; integrated into drivetrain | Crankset-specific; not transferable between bikes easily | Performance cyclists with dedicated race bike |
| Hub-based (e.g. PowerTap G3) | Rear wheel hub | ±1.5% | Measures total power at the wheel; independent of drivetrain | Wheel-specific; can't change tyres without losing the meter | Track cyclists; indoor trainers (less common now) |
| Smart trainer built-in (e.g. Wahoo KICKR, Tacx Neo) | Trainer resistance unit | ±1–2.5% (varies by model) | No additional purchase needed for indoor training | Indoor only; accuracy varies more than dedicated meters | Indoor-focused cyclists; those starting with power training |
For most recreational cyclists just starting with power training, a smart trainer’s built-in power measurement is sufficient — and already available if you ride indoors on Zwift or similar platforms. For outdoor-focused riders, pedal-based meters offer the best flexibility if you ride multiple bikes, while crank-arm meters provide good value for dedicated single-bike setups. Accuracy above ±2% is rarely a meaningful concern for training purposes — consistency between sessions matters more than absolute accuracy.
A power meter is only useful once you know your FTP — Functional Threshold Power, the maximum average power you can sustain for approximately one hour. FTP is the anchor point from which all your training zones are derived. Without an accurate FTP, your training zones are guesses, and your structured sessions are calibrated to fictional numbers.
The standard test: after a thorough warm-up of 20–25 minutes including some short hard efforts, ride as hard as you can sustain for 20 minutes. Take 95% of your average power for that 20 minutes — that’s your estimated FTP. The adjustment accounts for the fact that 20-minute maximal power is slightly higher than true 60-minute threshold power. A ramp test (power increases every minute until failure) is shorter and removes the pacing challenge but can be less accurate for some riders.
Retest every 6–8 weeks. FTP responds to training and changes meaningfully over the course of a training block — zones calibrated to your fitness from three months ago may be too easy (wasting adaptation stimulus) or too hard (generating excessive fatigue without the intended benefit). Our FTP test cycling guide covers test preparation, execution, and pacing strategy in detail. Once you have your number, use our cycling power zone calculator to set your zones instantly.
The most widely used system for cycling power zones is a seven-zone model based on FTP percentages, developed by Dr. Andy Coggan. Most training software uses this or a simplified five-zone version. The zones represent distinct physiological adaptations — training in the wrong zone for a session’s purpose produces the wrong adaptation.
| Zone | Name | % of FTP | How it feels | Primary adaptation | Typical session structure |
|---|---|---|---|---|---|
| Z1 | Active recovery | <55% | Effortless; almost too easy | Recovery; blood flow without fatigue | Recovery rides; cooldowns; warm-ups |
| Z2 | Endurance | 56–75% | Comfortable; conversational; could ride for hours | Aerobic base; fat oxidation; mitochondrial development | Long steady rides 2–6+ hours; base building |
| Z3 | Tempo | 76–90% | Comfortably hard; breathing elevated; sentences are short | Muscular endurance; lactate tolerance; sustained power | 20–60 min continuous; 2×20 min intervals |
| Z4 | Threshold | 91–105% | Hard; uncomfortable to sustain; breathing laboured | Raises lactate threshold; FTP improvement | 10–30 min continuous or 2×20, 3×15, 4×10 min intervals |
| Z5 | VO2max | 106–120% | Very hard; gasping; sustainable only briefly | Raises aerobic ceiling; VO2max development | 3–8 min intervals; 4×5 min, 5×4 min |
| Z6 | Anaerobic capacity | 121–150% | Maximal short efforts; can't speak | Anaerobic power; repeatability | 30s–2 min; 30/30s, Tabata-style |
| Z7 | Neuromuscular power | >150% | Sprint — absolute maximum | Peak power; neuromuscular recruitment | 5–15 second maximal efforts; sprint work |
For most recreational and amateur cyclists, the bulk of effective training happens in Zones 2, 3, and 4. Zone 2 builds the aerobic base that supports everything else. Zone 4 directly raises FTP. Zone 3 (sweet-spot training — 88–93% of FTP) is a productive middle ground that many coaches use heavily because it produces threshold-adjacent adaptation without the full recovery cost of true threshold work. Our structured cycling training plan guide shows how these zones are periodised across a training week and across a training block.
Power meters generate a lot of data. Most of it is interesting. Some of it is useful. Here’s what matters and what to do with it.
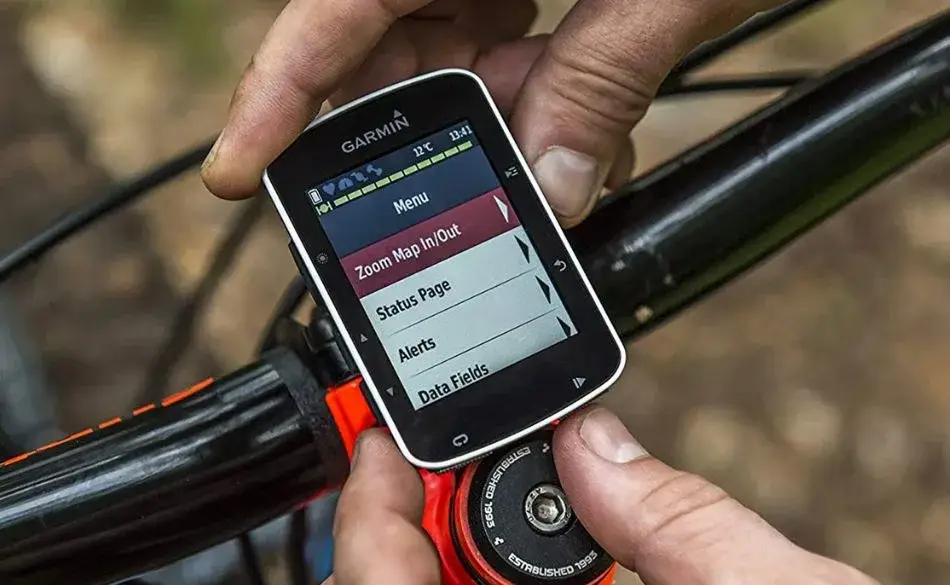
3-second average power — what to watch during a ride. Instant power fluctuates constantly with every pedal stroke and every slight gradient change; it’s too noisy to follow. The 3-second average smooths this into a usable signal. Set your cycling computer to display 3-second average as the primary power field during workouts. Some riders prefer 5-second average for hillier or more variable rides.
Average power — the mean power for a session or interval, including zeros from coasting. Useful for understanding overall session output but less meaningful than Normalized Power for variable riding.
Normalized Power (NP) — a weighted average that accounts for the metabolic cost of surges and variable effort. Because cycling is rarely steady-state (hills, junctions, accelerations), NP better represents how hard a ride actually was physiologically. A flat 60-minute effort at 220W average and 221W NP is very different from a hilly ride with 195W average and 225W NP — the second is metabolically harder despite the lower average. Watch the NP:average power ratio (called Variability Index or VI) to assess how smooth your pacing was: a VI below 1.05 on a long ride indicates controlled, efficient pacing.
Intensity Factor (IF) — NP divided by your FTP. An IF of 1.0 means you rode at exactly FTP effort for an hour. An IF of 0.75 means a steady endurance ride. An IF of 0.85–0.90 means sweet-spot territory. Useful for quickly categorising how hard a session was in relation to your threshold.
Training Stress Score (TSS) — a combined measure of IF and duration that quantifies the overall training load of a ride. Riding for one hour at exactly FTP generates 100 TSS. An easy 90-minute endurance ride at IF 0.70 generates around 70 TSS. A hard 2-hour race at IF 0.90 generates around 162 TSS. TSS accumulates across a week and forms the basis for tracking training load and planning recovery. Most training platforms (TrainingPeaks, Intervals.icu) display TSS and use it to model fitness and fatigue.
Power-to-weight ratio (W/kg) — your FTP divided by your body weight in kilograms. This is the most meaningful comparative metric in cycling because it normalises power for different body weights on the same climb. A rider producing 250W at 80kg (3.1 W/kg) climbs slower than one producing 210W at 60kg (3.5 W/kg). See our average FTP by age guide for W/kg benchmarks by age group and gender.
A power meter is only as accurate as its calibration. Temperature changes affect the strain gauges — a meter calibrated at room temperature before an indoor warm-up will read inaccurately on a cold outdoor morning. The solution is simple and takes a few seconds: perform a zero-offset (sometimes called spindown or calibration depending on the device) before every outdoor ride, after your warm-up when the drivetrain has reached working temperature.
The process: stop pedalling with no force on the cranks, then initiate zero-offset from your cycling computer (usually under the connected sensors menu) or the manufacturer’s app. The device resets its strain gauge baseline to zero. This single habit is what makes power data meaningfully comparable from ride to ride — without it, the numbers drift and comparisons between sessions become unreliable.
Indoor smart trainer users generally need to perform a spindown calibration (usually in the manufacturer’s app) periodically — weekly for high-use trainers — and when ambient temperature changes significantly. Most training platforms prompt this if the trainer data appears inconsistent.
Power and heart rate measure different things. Power is immediate and objective — it tells you what work is being done right now. Heart rate is a lagging physiological response — it tells you how your body is responding to that work, but 20–60 seconds after the fact and influenced by temperature, hydration, caffeine, stress, fatigue, and training history.
For interval training, use power. The immediacy of power data is what makes it the right tool for hitting specific intensities during 4-minute VO2max efforts or 20-minute threshold blocks. By the time heart rate reflects the intended intensity of a short interval, the interval is half-done. Power lets you target the zone from the first pedal stroke.
For monitoring fatigue and tracking long-term fitness trends, use heart rate alongside power. A useful signal: if your heart rate at a given power output is significantly higher than usual — say, you’re riding at 200W and your heart rate is 15 beats higher than it typically is at that power — it often indicates incomplete recovery, early illness, or accumulated training fatigue. Power-to-heart-rate ratio over time is one of the most sensitive early warning signals for overtraining that data-driven cyclists use. Our heart rate zone training guide covers how to set up and use heart rate alongside power for cyclists.
The practical approach most coaches advocate: train by power for prescribed intensity sessions, use heart rate as a secondary check on endurance rides and as a fatigue monitoring tool across the training week.
Pacing with power outdoors is harder than it looks. Roads are variable — gradients, wind, corners — and power fluctuates dramatically from moment to moment in a way that’s genuinely difficult to smooth out. The most common mistake new power meter users make is chasing the instant power number, which produces an erratic ride full of surges and backing off rather than smooth, controlled effort.
The discipline to develop: ride to the 3-second average power target and ignore instant fluctuations. On a slight uphill, power may momentarily read 300W; on a brief descent, 120W. Both are fine if the 3-second average stays near your target. The goal is a ride where your normalised power and average power are close together — which indicates smooth, metabolically efficient pacing.
For climbs and time trial efforts, power pacing is particularly valuable. The classic mistake is starting a long climb at a power that’s sustainable for the first five minutes but not for the full ascent. A power meter lets you cap the first two minutes at your target power even when it feels easy, then maintain it as effort increases later. This even-pacing approach almost always produces a faster final time than an aggressive start followed by a fade.
For outdoor interval sessions, find a road with consistent gradient and minimal traffic intersections. Straight flat roads or consistent-gradient climbs work well. For rides with constant interruptions (stop lights, traffic), indoor training on a smart trainer produces cleaner interval data and better adaptation per session. Our Zwift and indoor cycling guide covers how to structure power-based sessions indoors, including the ERG mode question — which Coach Pav’s guidance addresses well: turn ERG mode off when learning to pace, because ERG masks the skill of maintaining power through cadence management.
The fundamental principle of power-based training is the same as all effective endurance training: appropriate stimulus followed by sufficient recovery. Power meters make it easier to apply this principle correctly by removing the guesswork about whether sessions are hitting the right intensity.
A well-structured week for a cyclist training 8–10 hours might look like: one threshold session (Zone 4 intervals, targeting FTP improvement), one Zone 2 endurance ride of 2+ hours (aerobic base), one sweet-spot session (Zone 3 — the highest-value moderate-intensity work), and the remaining rides at Zone 1–2 active recovery or Zone 2 endurance. The hard sessions are separated by easy or rest days. TSS accumulates across the week and informs when a cutback week is due — when weekly TSS has been high for 3 consecutive weeks, a lighter week (70–75% of normal TSS) allows the adaptation to consolidate.
Our cycling training week structure guide breaks down how to sequence session types through the week based on training hours available. For riders building from scratch with power for the first time, our FTP improvement guide covers realistic expectations and the specific training blocks that move the number.
Get a Plan Built Around Your Power Data
SportCoaching's cycling coaches use your FTP and power zones to build structured plans that target the right adaptations at the right time — sweet-spot, threshold, endurance, and VO2max work in the proportions that match your goals, schedule, and fitness level.
What does a cycling power meter measure?
Mechanical work output in watts, calculated from torque (measured by strain gauges detecting drivetrain deflection) multiplied by cadence. It measures the actual work being done — immediately and objectively — without being affected by heat, fatigue, caffeine, or stress.
Do I need a power meter to train structured cycling?
No — heart rate zones or perceived exertion work. But a power meter is significantly more precise, particularly for intervals. If you ride indoors on a smart trainer, you already have power measurement built in. For outdoor riding, a power meter is the most reliable way to hit intended intensities session after session.
What is FTP and how do I use it with a power meter?
FTP (Functional Threshold Power) is the maximum power you can sustain for approximately one hour — the anchor for all training zones. Zone 2 sits at 56–75% of FTP; Zone 4 threshold at 91–105%. Test every 6–8 weeks to keep zones accurate as fitness changes.
What is Normalized Power (NP) and why does it matter?
NP is a weighted average that accounts for the metabolic cost of variable efforts. It better represents how hard a ride was physiologically than average power, which includes coasting zeros. The ratio of NP to average power (Variability Index) tells you how smooth your pacing was.
How often should I calibrate my power meter?
Perform a zero-offset before every outdoor ride, after the warm-up when the drivetrain is at working temperature. Temperature changes affect strain gauge readings; consistent calibration is what makes power data comparable between sessions.
Ready to put your training to the test? Here are some upcoming cycling events matched to this article.



Head Coach & Founder, SportCoaching
Graeme is the founder of SportCoaching and has coached more than 750 athletes from 20 countries, from beginners to Olympians, in cycling, running, triathlon, mountain biking, boxing, and skiing. His coaching philosophy and methods form the foundation of SportCoaching's training programs and resources.
No matter your goals, SportCoaching offers tailored training plans to suit your needs. Whether you’re preparing for a race, tackling long distances, or simply improving your fitness, our expert coaches provide structured guidance to help you reach your full potential.
Structured cycling coaching to build power, endurance, and speed.
What’s included
Browse upcoming Australian running, cycling, and triathlon events in one place. Filter by sport, check dates quickly, and plan your training around something real on the calendar.
Choose your plan to get started with personalized training plans designed to help you reach your goals.


Minna Backman
When you’re new, feedback is especially important, and Graeme is highly skilled at both analyzing numbers and understanding the importance of mental strength.